Australia’s emission targets and projections have become a central topic of debate, straddling global environmental commitments and domestic economic priorities, within the political landscape.
There is frequent debate about what Australia’s emissions targets should be, or whether Australia is on track to meet current emissions targets. Seemingly small changes can have material impacts on these but receive very little attention. It’s important to take a closer look at how emissions are changing across industries, and across calculation methods.
One material change that we have seen is in recalculated land use, land use change and forestry (LULUCF) emissions. LULUCF measures the emissions or removals of greenhouse gases between the terrestrial biosphere and the atmosphere as a result of human induced land use, land-use change, and forestry activities.
The growing role of LULUCF in meeting Australia’s 2030 emissions targets
Since the last official emissions projections in November 2023, a material change has been made in the calculation to LULUCF that makes a significant improvement to official emissions (though it has received very little mention).
The Department of Climate Change, Energy, the Environment and Water (DCCEEW)’s November 2023 projections estimated a 42% reduction in 2030 against the 43% 2030 point target (assuming policy measures proceed):
Tracking towards Australia’s 2030 point target
| Emissions in 2030, Mt CO2-e | % below 2005 | |
|---|---|---|
| 2030 Target | 351 | 43% |
| Baseline scenario | 387 | 37% |
| ‘With additional measures’ scenario | 358 | 42% |
Tracking towards Australia’s 2030 emissions budget target
| Cumulative emissions, 2021-2030 Mt CO2-e | % above/below emissions budget | |
|---|---|---|
| 2021-2030 emissions budget | 4,353 | - |
| Baseline scenario | 4,392 | 1% |
| ‘With additional measures’ scenario | 4,322 | -1% |
Source: DCCEEW - Australia's Emissions Projections 2023, Table 1, Table 2
Since those 2023 projections were made, the accounts have materially improved due to a recalculation of LULUCF emissions acting to reduce historical emissions and future projected emissions.
A recent recalculation of Australia’s LULUCF emissions are likely to make the 2030 emissions target around 4-5 percentage points easier to meet.
The November 2023 emissions projections originally held 2022 LULUCF emissions removals at -64Mt CO2–e, with total economy wide emissions being 462Mt CO2–e.
That’s fallen in the updated accounts, made public after the November 2023 emissions projections, to -88Mt CO2–e LULUCF emissions removals and 433Mt CO2–e total economy wide emissions in 2022. This is a reduction of around 30Mt CO2–e due to a recalculation of past emissions. This is mostly due to LULUCF (24Mt CO2–e lower), but agriculture is also 2Mt CO2–e lower.
To put that in perspective, the LULUCF sink is now larger than the agriculture sector’s entire emissions.
Actual annual emissions, by sector, for the year to December 2022 and 2023
| Sector | Annual emissions (Mt CO2-e) year to December 2022 | Annual emissions (Mt CO2-e) year to December 2023 | Change (%) |
|---|---|---|---|
| Energy – Electricity | 154.9 | 150.6 | -2.8% |
| Energy – Stationary energy excluding electricity | 101.1 | 100.3 | -0.8% |
| Energy – Transport | 94.2 | 97.6 | 3.6% |
| Energy – Fugitive emissions | 47.9 | 46.9 | -2.1% |
| Industrial processes and product use | 32.8 | 32.6 | -0.6% |
| Agriculture | 78.9 | 79.5 | 0.7% |
| Waste | 13.9 | 13.9 | 0.0% |
| Land Use, Land Use Change and Forestry | -88.4 | -88.4 | 0.0% |
| National Inventory Total | 435.3 | 432.9 | -0.5% |
Recalculations (Mt CO2-e) since the September 2023 Quarterly Update, by sector, 2005, 2022 and 2023
| FY 2005 | FY 2022 | FY2023 | FY 2024 | ||||||||||
|---|---|---|---|---|---|---|---|---|---|---|---|---|---|
| Sep | Dec | Mar | Jun | Sep | Dec | Mar | Jun | Sep | Dec | Mar | Jun | Sep | |
| Agriculture | -0.3 | -0.3 | -0.3 | -0.3 | -0.5 | -0.5 | -0.4 | -0.4 | -0.6 | -0.6 | -0.6 | -0.6 | -0.4 |
| Electricity | 0.0 | 0.0 | 0.0 | 0.0 | -0.2 | 0.0 | 0.1 | 0.1 | 0.6 | 0.3 | 0.6 | 0.6 | 0.6 |
| Stationary energy (excluding electricity) | 0.0 | 0.0 | 0.0 | 0.0 | 0.0 | 0.0 | 0.0 | 0.0 | -0.2 | -0.2 | -0.2 | -0.2 | -0.2 |
| Transport | 0.0 | 0.0 | 0.0 | 0.0 | 0.0 | 0.0 | 0.0 | 0.0 | 0.0 | -0.1 | -0.1 | -0.1 | -0.1 |
| Fugitive emissions | -0.4 | 0.1 | 0.6 | -0.4 | 0.0 | 0.1 | -0.1 | 0.0 | -0.2 | 0.1 | 0.2 | -0.1 | 0.1 |
| Industrial processes and product use | 0.0 | 0.0 | 0.0 | 0.0 | 0.0 | 0.0 | 0.0 | 0.0 | 0.0 | 0.0 | 0.0 | 0.0 | 0.0 |
| Waste | 0.0 | 0.0 | 0.0 | 0.0 | 0.0 | 0.0 | 0.0 | 0.0 | 0.0 | 0.0 | 0.0 | 0.0 | 0.0 |
| LULUCF | -1.4 | -1.4 | -1.4 | -1.4 | -6.2 | -6.2 | -6.0 | -6.1 | -6.2 | -6.2 | -6.0 | -6.1 | -6.2 |
| Total | -2.1 | -1.6 | -1.1 | -2.1 | -6.8 | -6.5 | -6.5 | -6.5 | -6.6 | -6.6 | -6.1 | -6.5 | -6.2 |
Source: DCCEEW - NGGI Quarterly Update Dec 2023, Table 3, Table 5
More details on the recalculations can be found in the National Inventory Report here.
When the latest emissions projections are produced later in 2024, the recalculation of LULUCF should decrease LULUCF emissions for all years in the updated projections.
Based on the materiality of the LULUCF emissions recalculation, the projected 2030 point emissions target should be around 24Mt CO2–e lower, and cumulative emissions for 2021-30 should be nearly 240Mt CO2–e lower (since the LULUCF emissions recalculation retrospectively changes the profile of 2021-2023 emissions, which are incorporated into the 2021-30 carbon budget target).
That LULUCF emissions recalculation alone (which is not reflected in the 42% projected emissions reduction contained in the November 2023 projections) is likely equivalent to further improvement of around 4 percentage points.
That means the estimated projections of 37-42% should be closer to 41-46% when the projections are updated (expected in December 2024) due to this change alone. Though there will also be changes in other sectors.
How the LULUCF recalculations impacts emissions targets in other sectors
There is also talk of renewables falling behind target but, for context, in the November 2023 projections the difference between 82% renewables and 72% renewables by 2030 was estimated at around 21 Mt CO2–e (a difference of 3.5 percentage points toward the 2030 emissions target). A 24 Mt CO2–e improvement in LULUCF more than offsets this and means the emissions target can still be met with lower renewables.
There are some important implications:
- The task for other sectors becomes easier: for example, the current target can likely be reached with nearer to 70% renewables by 2030, and
- Any debate about future targets (including 2035) is difficult when the LULUCF accounting can change so materially.
Historical analysis paints an even bigger picture
Changes to the LULUCF emissions profile are even bigger when going back a few years, particularly since 2020.
The chart below shows LULUCF emissions (historical and projected) since 2021. Each series in the chart represents the year of the emissions projection (though 2024* is an estimate consistent with the latest recalculation to LULUCF emissions rolled forward to 2030).
As shown, historical emissions (solid lines) have fallen a lot since 2021.
Technically, the change also reduces the 2005 emissions, and hence the 2030 target, but that impact is comparatively very small.
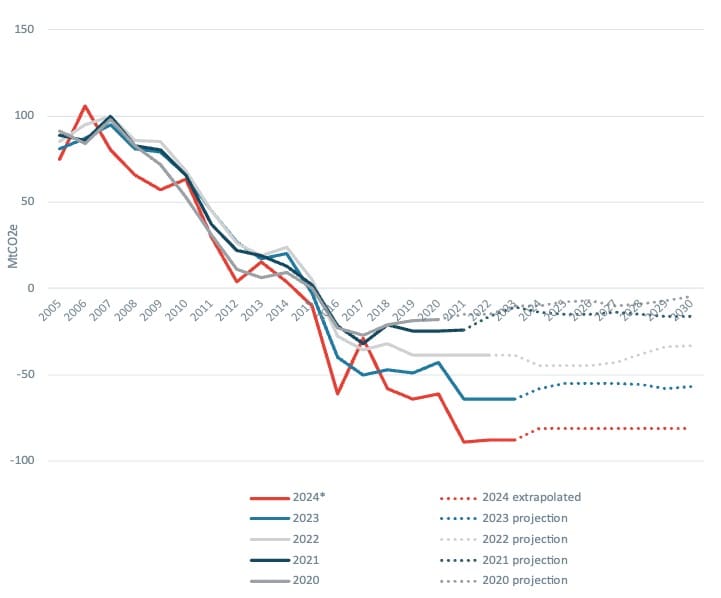
LULUCF emissions for the year 2021 have now been revised from -24 Mt CO2–e (2021 projection) to -89 Mt CO2–e per year (per the latest accounts), with cumulative 2021-30 emissions falling from -140 Mt CO2–e to (likely) around -832 Mt CO2–e.
Extrapolated to 2030, the change in LULUCF emissions from the 2021 projection to the likely 2024 projection reduces total emissions by:
- 65 Mt CO2–e per year, which is close to an 11 percentage point difference to the 2030 point target, and
- 692 Mt CO2–e cumulative from 2021-30 (about 16 percent of the emissions target budget).
This means that meeting 43% with the updated LULUCF calculation is comparable to achieving 32% with the 2021 LULUCF calculation.
This also means that net zero is far more achievable (on paper) with LULUCF projected to provide a sink of around 89 Mt CO2–e per year (enough to offset the entire agriculture sector) compared with around 24 Mt CO2–e per year in projections from just 3 years ago.
| 2030 Point estimate | Budget (2021-30) | ||||||
|---|---|---|---|---|---|---|---|
| 2021 LULUCF (Mt) | 2030 LULUCF (Mt) | Change relative to 2021 projections (Mt) | Percentage point difference to 2030 target | 2021-30 LULUCF (Mt) | Change relative to 2021 projections (Mt) | Percentage impact relative to 2021-30 budget | |
| 2021 projections | -24 | -16 | 0 | -140 | |||
| 2022 projections | -39 | -33 | -17 | 2.8% | -400 | -260 | 6% |
| 2023 projections | -64 | -57 | -41 | 6.7% | -586 | -446 | 10% |
| 2024* (extrapolated) | -89 | -81 | -65 | 10.6% | -832 | -692 | 16% |
| LULUCF Change since 2023 | -24 | 3.9% | -246 | 5.7% | |||
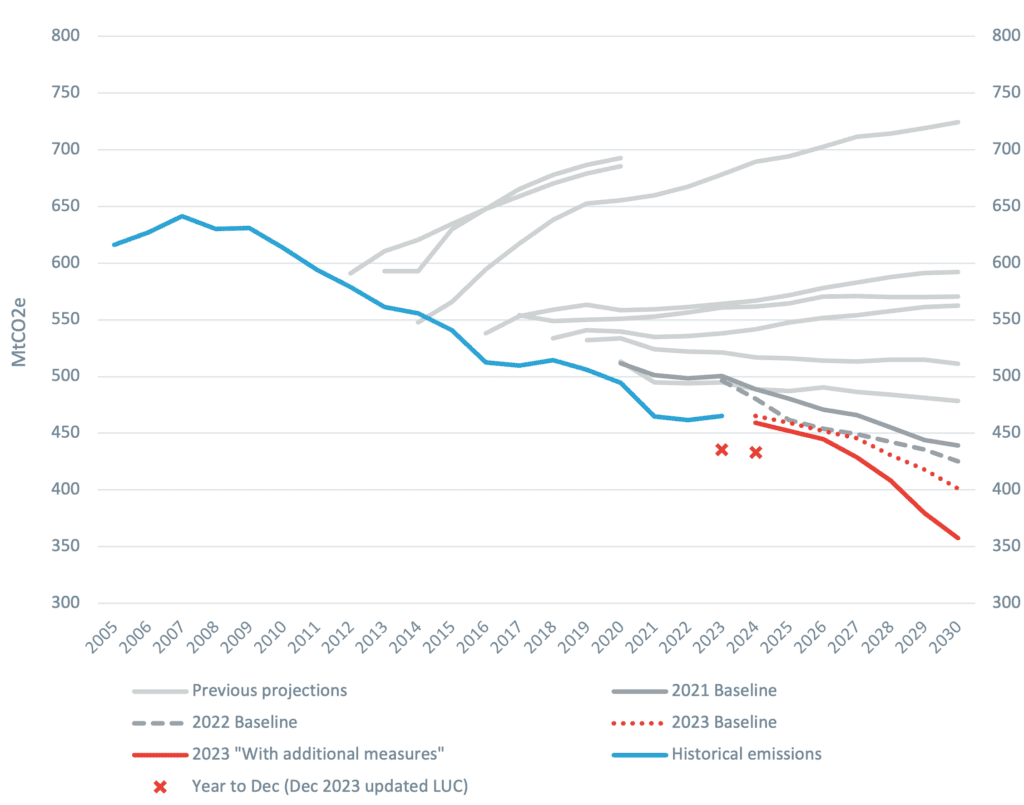
As always, it is vital to reflect on how Australia’s emissions projections have changed over time relative to past projections when considering the meaning of any new projections.
The chart below shows how much the total emissions projections have fallen over time each year: not all of that improvement is a result of changes to LULUCF emissions, but the red ‘X’s are just updating for the latest LULUCF emissions projections.
If history is any guide, there will likely be improvements in other sectors as new policies are introduced, even if renewables growth is slower than the target.
One thing is becoming clearer: It’s increasingly likely that Australia’s 43% 2030 emissions target will be met. So, the question worth asking now is how these changes in LULUCF are accounted for in setting a 2035 target.
We've played a pioneering role in efforts against greenhouse gas emissions and towards net-zero goals. Our economic analysis and energy modelling continues to support the development of world-first public policy and private sector investment to emissions reductions, biodiversity preservation and sustainability.